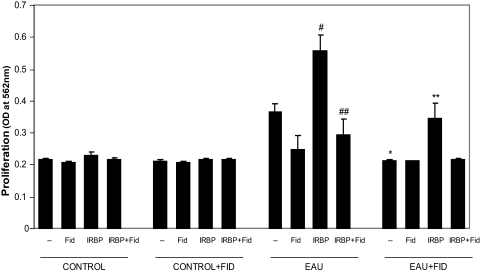
Figure 5.
Inhibitory effect of the AR inhibitor fidarestat on the proliferation of spleen-derived T cells after stimulation with IRBP. The proliferation of cultured cells was examined by MTS assay. The results are expressed as mean ± SD (n = 4). #P < 0.02 vs. Control cells treated with IRBP alone. ##P < 0.04 vs. EAU cells treated with IRBP alone. *P < 0.01 vs. untreated EAU-derived T cells. **P < 0.05 vs. EAU cells treated with IRBP alone.

