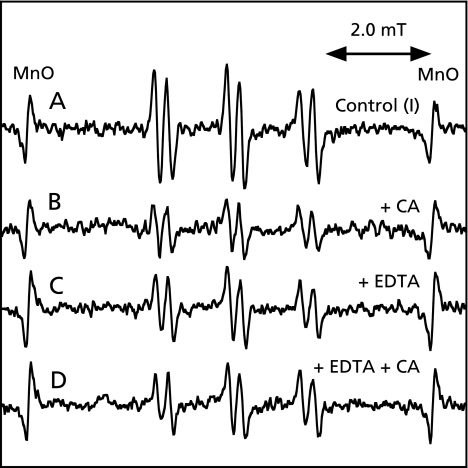
Fig. 3.
ESR spectra of the reaction mixtures of rat liver microsomes with ADP, Fe3+ and NADPH. The reaction and ESR conditions were as described in Materials and Methods. Total volume of the reaction mixtures was 200 µl. A, a control reaction mixture (I) of rat liver microsomes with ADP, Fe3+ and NADPH; B, same as in A except that 1 mM CA was added; C, same as in A except that 1 mM EDTA was added; D, same as in A except that 1 mM EDTA and 1 mM CA.

