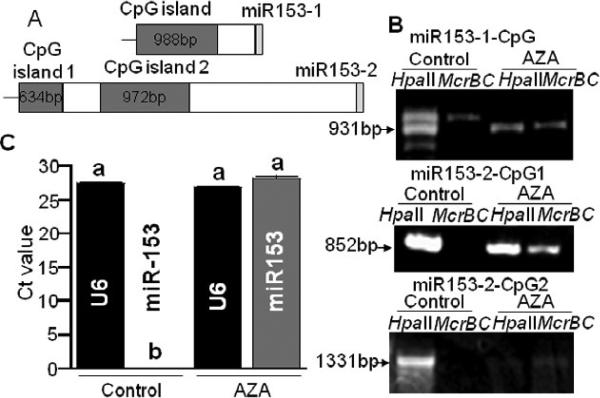
FIGURE 4.
Cytosine methylation in CpG islands in the upstream regions of miR-153-1 and miR-153-2 genes. (A) CpG islands and mature miR-153 in miR-153-1 and miR-153-2 genes. (B) Analysis of cytosine methylation in the CpG islands in miR-153-1 and miR-153-2 in AZA-treated and AZA-free (control) HEK-293 cells. (C) Abundance of miR-153 abundance; U6 snRNA = internal standard in stem-loop qRT-PCR of miR-153. Note that statistical analysis of panel C data was conducted by comparing U6 vs. U6 and miR-153 vs. miR-153 in AZA-treated cells and untreated controls. Values are means ± SD, n=3. Means without a common letter differ, P < 0.05.

