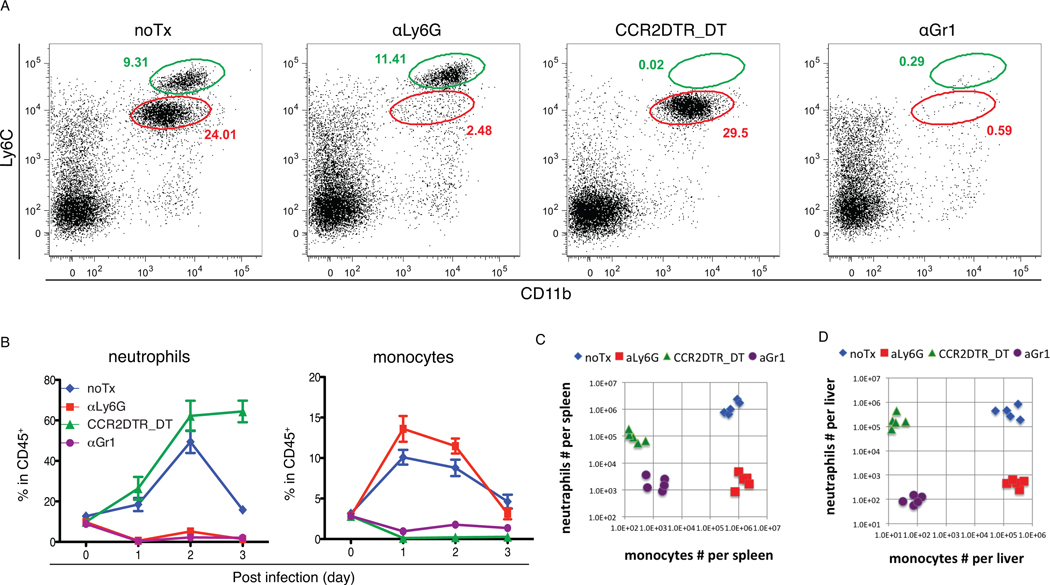
Figure 2. Differential depletion of monocytes and neutrophils.
C57BL/6 or CCR2-DTR mice were infected with 3000 L. monocytogenes. αLy6G 1A8 ab or αGr1 RB6-8C5 ab was injected i.p. upon infection and daily post infection. DT was injected upon infection and at d2 post infection. (A). Blood was obtained from infected mice with indicated treatment, and analyzed by flow cytometry. FACS plots show CD45+ nucleated cells in the circulation at d1. (B). Frequencies of Ly6Chi monocytes and neutrophils in CD45+ nucleated cells were monitored at the indicated time points after infection. Numbers of Ly6Chi monocytes and neutrophils were numerated in spleens (C) and livers (D) from mice with indicated treatment 3d after infection. Data are presented as the arithmetic mean ± SEM.

