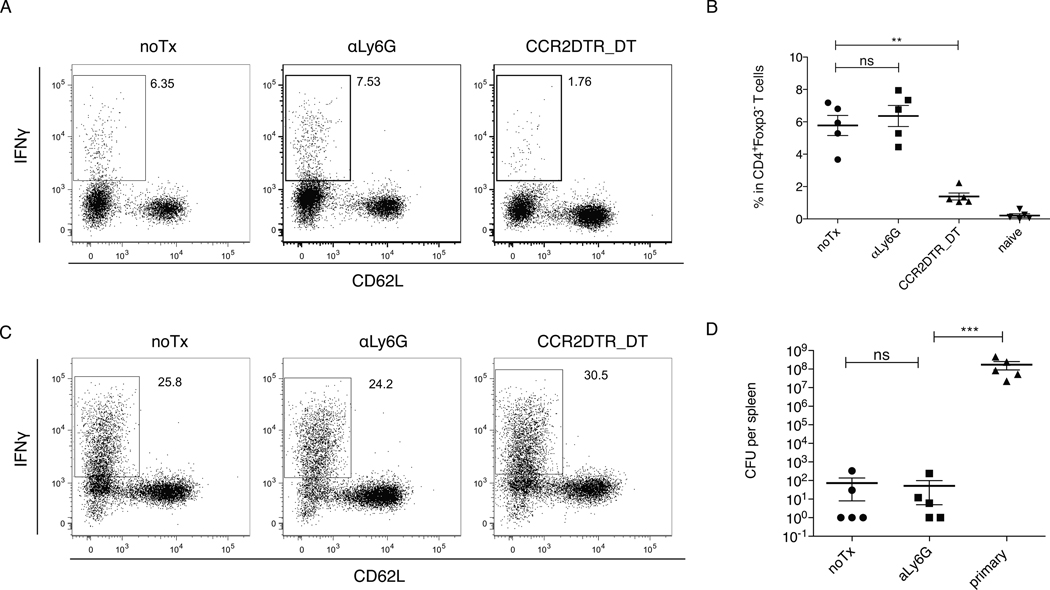
Figure 5. T cell responses are not affected by depletion of neutrophils.
OT1 TCR-tg cells were adoptively transferred into C57BL/6 or CCR2-DTR mice 1d before infection with 1e5 LM-OVA. αLy6G 1A8 ab or αGr1 RB6-8C5 ab was injected i.p. daily during the period of d4-7. DT was injected i.p. at every other day during the period of d4-7. T cells were isolated from spleens at d7.5 after infection, and were re-stimulated in vitro with peptide-pulsed DC in the presence of brefeldin A for 5h, followed by intracellular cytokine staining.
(A). Representative FACS plots of CD4+Foxp3− T cells recovered from spleens of infected mice that have undergone treatments as indicated. T cells were re-stimulated with DC plus LLO190–201 peptides. (B). Frequencies of IFNγ producing cells among CD4+Foxp3− T cells. (C). Representative FACS plots of OT1 TCR-tg cells recovered from spleens of recipient mice that have undergone treatments as indicated. T cells were re-stimulated DC plus OVA (SIINFEKL) peptides. (D). C57BL/6 or CCR2-DTR mice were infected with 3000 WT L. monocytogenes. αLy6G 1A8 ab was injected i.p. daily during the period of d4-7. Mice were re-challenged with 5 × 10⁵ WT L. monocytogenes at d21 after the first infection. Viable Listeria from spleens were quantified 3d after secondary infection, and compared with that from primary infection. Data are presented as the arithmetic mean ± SEM. **, P ≤ 0.01; ***, P ≤ 0.001.

