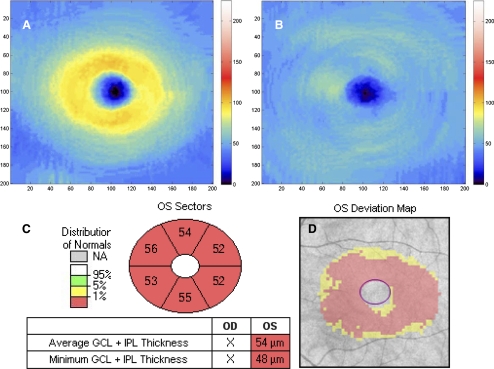
Figure 2.
GCIPL thickness maps (the denser the orange/yellow ring, the thicker the GCIPL) of a normal eye (A) and an eye with severe glaucoma (B). GCIPL deviation map (C) and significance map (D) of the same eye shown in B. The red on the deviation map indicates regions with GCIPL thickness outside normal limits. The significance map shows (clockwise) thicknesses of the superior, superonasal, inferonasal, inferior, inferotemporal, and superotemporal sectors of the annulus and the average and minimum GCIPL (box).

