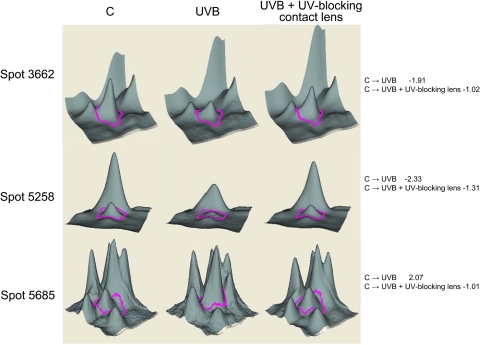
Figure 2.
Analysis of changes in lens epithelial cell proteins induced by UVB exposure in the absence and presence of UV-blocking contact lenses. The 3D data sets for representative proteins are shown. Quantitative image analysis data for identified proteins are shown in Table 2. Right: fold changes between each sample.

