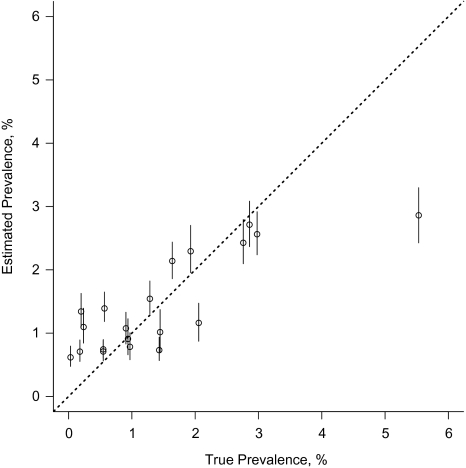
Figure 3.
Validation of network scale-up estimates for 20 populations of known size in Curitiba, Brazil, 2010. (A list of the 20 populations is presented in the Web Appendix.) The estimates were generally similar to the true values, but there was a tendency to overestimate the sizes of small groups and underestimate the sizes of large groups, a pattern that has been observed in other scale-up studies as well (29, 30). The purported 95% confidence intervals also had poor coverage properties. The 1 outlier in the plot represents the group “middle school students in a public school.” Bars, estimated 95% confidence interval.

