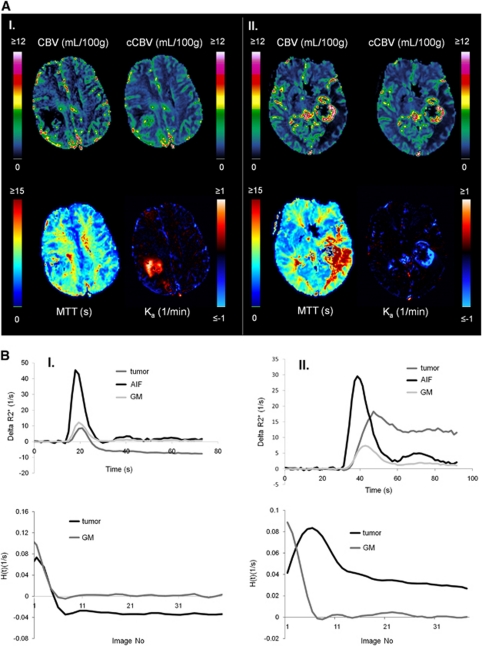
Figure 4.
Sample cases showing T1- and T2*-dominant CA extravasation analyzed using Method II. (A) The images show non-corrected (CBV) and leakage-corrected (cCBV) cerebral blood volume maps, leakage-corrected MTT maps and apparent rate constant (Ka) maps where blue-shade colors represent T2*-dominant Ka values and red-shade colors T1-dominant Ka values. In spite of same tumor grade, sequence parameters, and contrast agent dose, case I (left, male 40 years) exhibits predominant T1-extravasation, whereas case II (right, male 60 years) exhibits predominant T2*-extravasation. (B) Dose-response curves (top row) and corresponding residue functions obtained from tumor ROIs from the cases shown in panel A. CBV, cerebral blood volume; MTT, mean transit time; ROI, region of interest.

