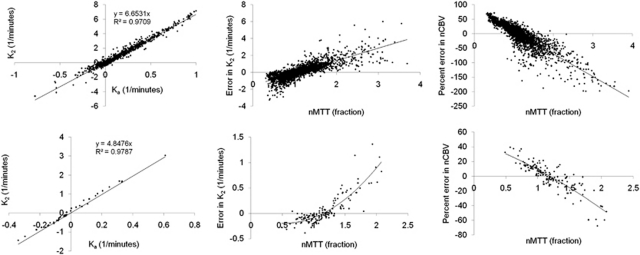
Figure 6.
Pixel-wise analysis of error in K2 and nCBV as function of nMTT in two sample cases. The left column shows the relationship between Ka and K2 for pixels with 0.9<nMTT<1.1. A high correlation was observed in both cases confirming the validity of the assumption that Ka and K2 are linearly related for nMTT values close to unity. The middle column shows the deviation (ΔK2) from the expected linear relationship between K2 and Ka as function of nMTT. The right column shows the percentage deviation between normalized corrected CBV values (nCBV) obtained with Method I and nCBV values obtained with Method II (ΔnCBV) as function of nMTT. The resulting dependence of ΔK2 and ΔnCBV on nMTT was found to be in good agreement with results from simulations as shown in Figure 3. nMTT, normalized mean transit time; nCBV, normalized cerebral blood volume.

