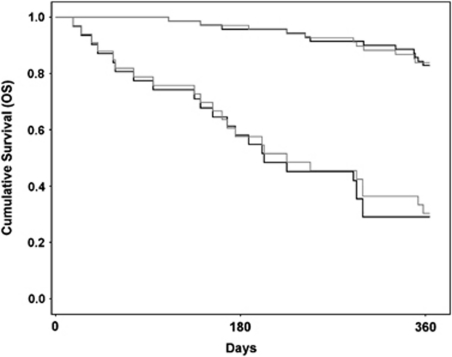
Figure 7.
Kaplan–Meier survival analysis for Method II (black lines) compared with Method I (gray lines) when separating a ‘high-risk' group with expected survival of <1 year from a ‘low-risk' group with expected survival of >1 year. A higher log-rank value was observed for correction Method II than for Method I (23.69 versus 16.46).

