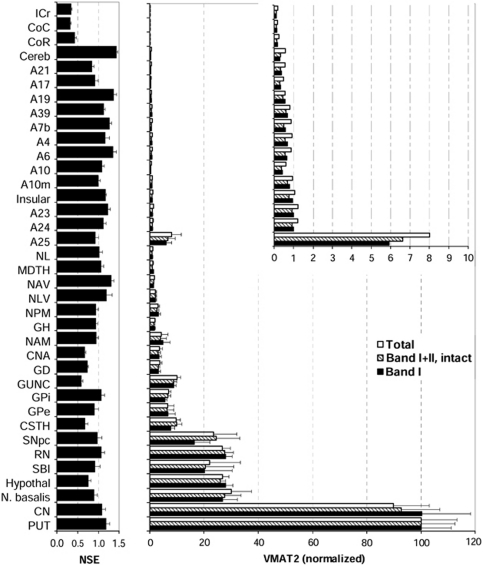
Figure 5.
Regional brain distribution of vesicular monoamine transporter 2 (VMAT2) in normal human brain (n=6). Shown are normalized levels (mean±s.e.m.) of total (bands I–IV), intact (bands I–IIa/b), and mature (band I only) VMAT2 against the respective levels in putamen, the brain region with the highest levels of VMAT2 proteins. The inset shows enlarged graph of the cerebral and cerebellar cortical regions and white matters. Also shown are regional levels (in μg std/μg sample) of the control protein neuron specific enolase (NSE). See Figure 4 for abbreviations. Note that levels of VMAT2 in frontal (A10, A10m, A6, and A4), temporal (A21), parietal (A7b and A39), and occipital (A17 and A19) cerebral cortical areas and in cerebellar cortex are only a small fraction of those in the VMAT2-rich caudate and putamen.

