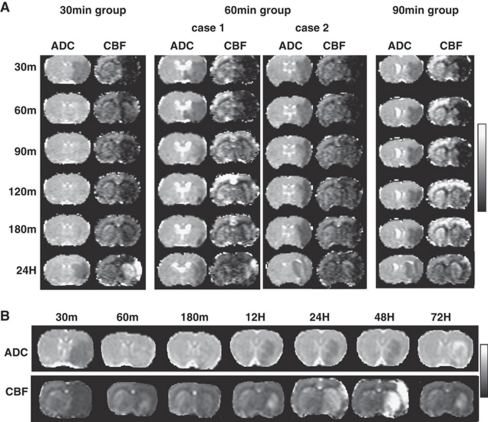
Figure 1.
(A) Spatiotemporal characteristics of ADC and CBF maps of representative rats from the 30-, 60-, and 90-minute middle cerebral artery occlusion (MCAO) groups. For the 60-minute MCAO group, a case with hyperperfusion (HP) and another case without HP are shown. (B) Spatiotemporal characteristics ADC and CBF maps up to 72 hours after occlusion of a representative rat from the 30-minute MCAO group. Display scales are 0 to 1.0 × 10⁻³ mm2/s for ADC and 0 to 2 mL/g per minute for CBF.

