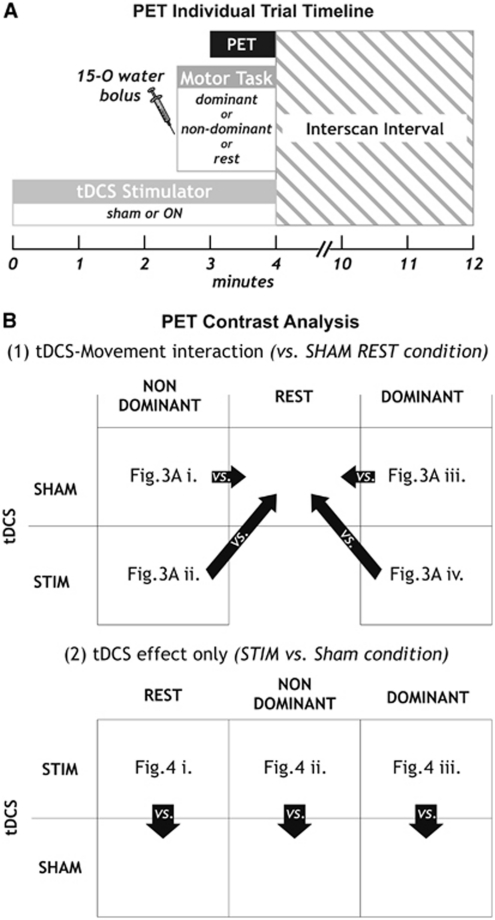
Figure 2.
Positron emission tomography (PET) experimental set-up. Individual trial timeline is shown in (A). The contrasts tested are shown in (B) for (1) transcranial direct current stimulation (tDCS)–movement interaction, contrasting conditions with tDCS SHAM during rest condition and (2) for stimulation effects only, where tDCS STIM was contrasted with tDCS SHAM for each of the three motor tasks. Each contrast is shown as Z-transformed difference images averaged across subjects in Figures 3 and 4, as indicated in the respective boxes. STIM, stimulation.

