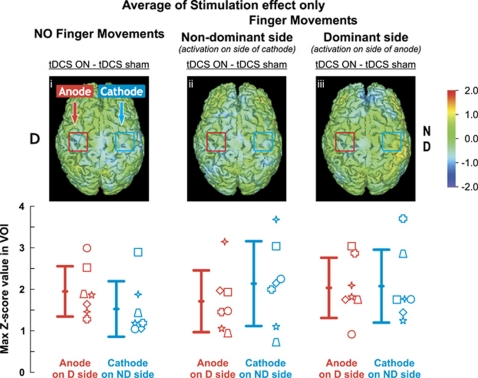
Figure 4.
Regional cerebral blood flow (rCBF) changes with bilateral transcranial direct current stimulation (tDCS) only. Z-transformed differences images averaged across seven subjects are shown above and group means (±1s.d.) are shown in the bottom row. Activations are shown during rest (versus sham rest) on the left panel (i), during movements of the nondominant hand (versus sham nondominant movement) in center panel (ii) and for the dominant hand (versus sham dominant movement) in the right panel (iii). No change was observed in ΔrCBF when contrasting tDCS stimulation versus sham with nondominant (center panel) or dominant (right panel) finger movements. The red (anode) and blue (cathode) squares drawn on each image correspond to the tDCS electrodes. Individual subjects are represented by the seven different symbols.

