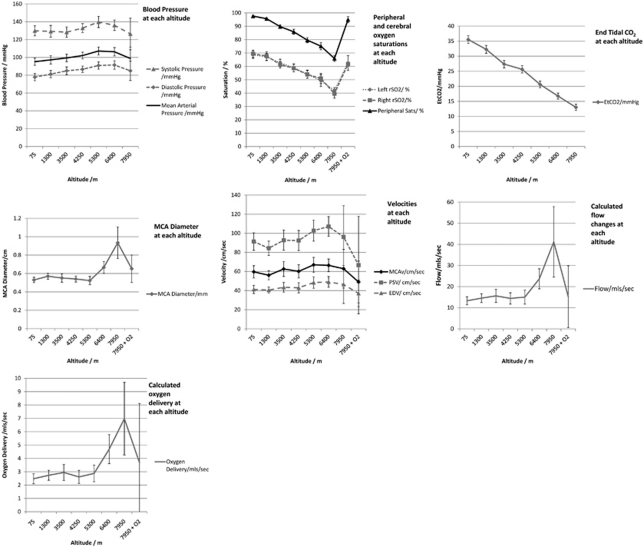
Figure 2.
Composite of seven graphs, demonstrating changes in blood pressure, arterial oxygen saturation (SaO2), regional cerebral oxygenation (rSO2), end tidal CO2 (ETCO2), peak systolic, end diastolic and mean velocities, middle cerebral artery (MCA) diameter (MCADiam), calculated MCA flow (MCAFlow), and oxygen delivery (note: blood pressure and EtCO2 were not reassessed after oxygen administration at 7,950 m).

