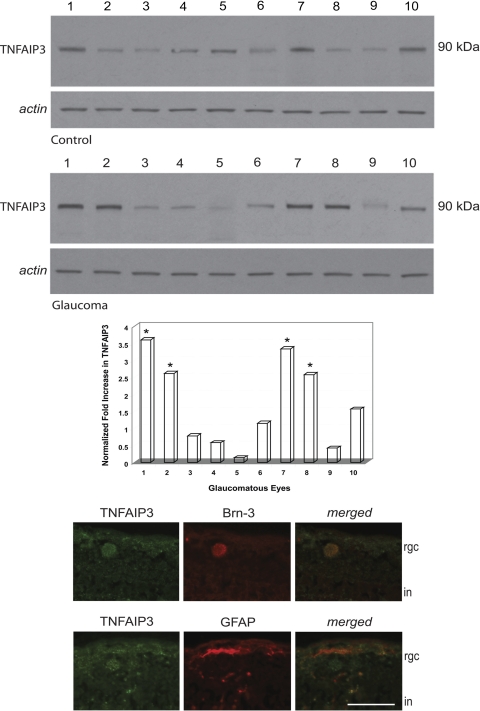
Figure 5.
TNFAIP3 expression in the glaucomatous human retina. Quantitative Western blot analysis using a specific antibody revealed prominent individual differences in the expression level of TNFAIP3. When the average β-actin–normalized intensity value obtained from control samples was used to calculate the fold change in TNFAIP3 immunolabeling, we detected a greater than two-fold increased expression in 4 of 10 glaucomatous samples. *P < 0.01, statistically significant difference (Mann-Whitney rank sum test). However, TNFAIP3 expression was unchanged or decreased in the rest of the glaucomatous samples. Immunolabeling of human tissues demonstrated TNFAIP3 (green) localization in both Brn-3–positive RGCs and GFAP-positive astrocytes (red) in the inner retina. rgc, retinal ganglion cell; in, inner nuclear layer. Scale bar, 50 μm.

