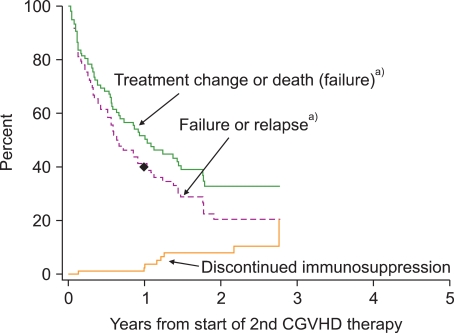
Fig. 3.
Historical outcomes after secondary systemic therapy for chronic GVHD. The upper solid curve shows time to treatment failure defined as a qualitative change in systemic therapy or death during secondary therapy. The dashed curve shows time to treatment failure or recurrent malignancy during secondary therapy. The lower solid curve shows the cumulative incidence of discontinued systemic treatment after resolution of chronic GVHD. The dot on the dashed line indicates that approximately 40% of patients were alive at 1 year after the onset of secondary treatment without a qualitative change in systemic therapy and without recurrent malignancy. Chronic GVHD was defined according to historical criteria and might not reflect results to be expected for patients with chronic GVHD defined according to NIH criteria. The figure is adapted from reference [29]. a)During secondary therapy.

