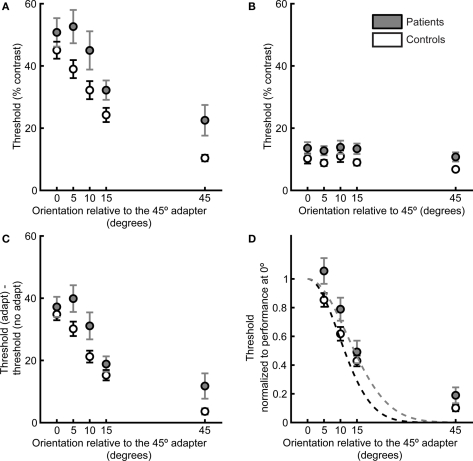
Figure 2.
Target detection thresholds as a function of adapter–target orientation offset define psychophysical orientation tuning curves. Data are plotted for patients (gray) and controls (white). (A) Contrast thresholds for detection of the post-adaptation target, as a function of adapter–target orientation offset. (B) Detection thresholds when no adapter was presented. (C) Difference in thresholds in the adaptation and no-adaptation condition. (D) For each participant, thresholds were normalized to performance at 0° adapter–target orientation offset, and a Gaussian tuning curve was fit to each participant’s data. Dashed lines indicate the means of the Gaussian fits for each subject group. Error bars indicate SEM for each group and condition.

