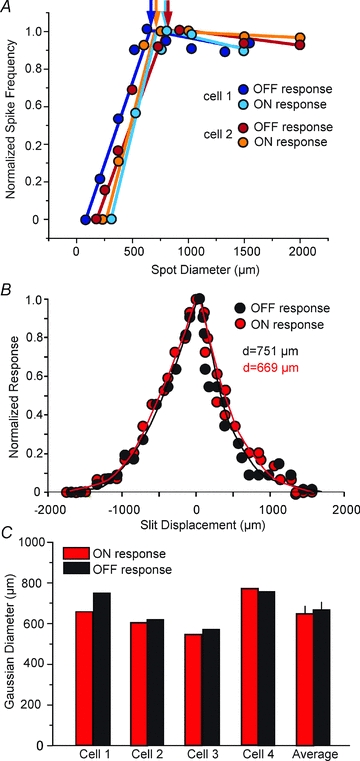
Figure 3. The classic OFF and unmasked ON responses of OFF α-GCs show similar area summation and receptive field profiles.

A, area summations were computed from extracellular spike recordings evoked by concentric spots of light of varying diameter, but of constant intensity. The curves show the area summation profiles of the ON (unmasked by PTX) and OFF responses of two OFF α-GCs in the rabbit retina. The area summation of all the responses fell within a common range suggesting that both ON and OFF signals were centre mediated. Reductions in the response profiles to larger spots of light are likely due to surround inhibitory mechanisms. Light intensities for green stimulus = 0.21 Rh* rod−1 s−1. B, receptive field profiles of the OFF and unmasked ON response following application of PTX to an OFF α-GC. The computed Gaussian diameters were very similar for the two responses. C, the receptive field Gaussian diameters computed for the OFF and unmasked ON responses for 4 OFF α-GCs and the composition averages. Like for the area summation measures, the receptive fields of the ON and OFF responses were very similar. Light intensity for white light stimulus = log –5.0. Maximum irradiance (log 0.0) = 2.37 mW cm−2
