
Figure 8. Mitochondrial volume density for the heart muscle (A), and cristae membrane surface area normalized to the outer membrane surface area (B).
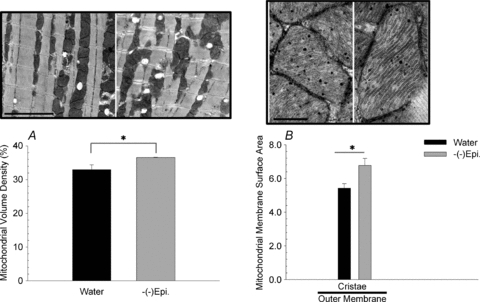
Data are means and SEM. The representative electron microscopy images of control (left side) and (–)-epicatechin (right side) treated muscle above each graph. For panel A, the scale bar represents 4 μm, whereas for panel B, the scale bar represents 400 nm. *P < 0.05.