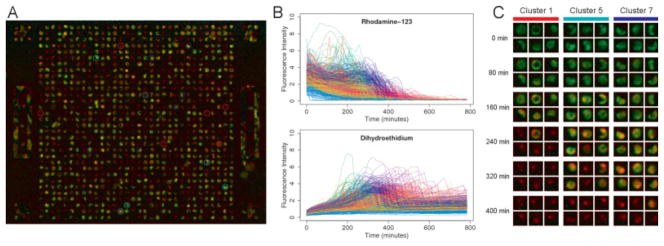
Figure 2. Using the microwell array cytometry system, single cell fluorescence time courses can be generated with minimal user intervention.
Panel A is a false color fluorescence image of primary hepatocytes stained with rhodamine 123 (green channel) and dihydroethidium (red channel) and exposed to 25 μM menadione for 4 h. Panel B shows the single cell time courses of Rh123 and DHE fluorescence generated from this and the other images in the time series, with images collected every 16 min for approximately 13 h. The color of each time course corresponds to the survival time determined for that cell. Panel C is an abbreviated time series highlighting individual cells in the array and the diversity of fluorescence patterns observed. k-means clustering was used to identify clusters of cells with similar time courses, and the highlighted cells in each column were randomly selected from these clusters.

