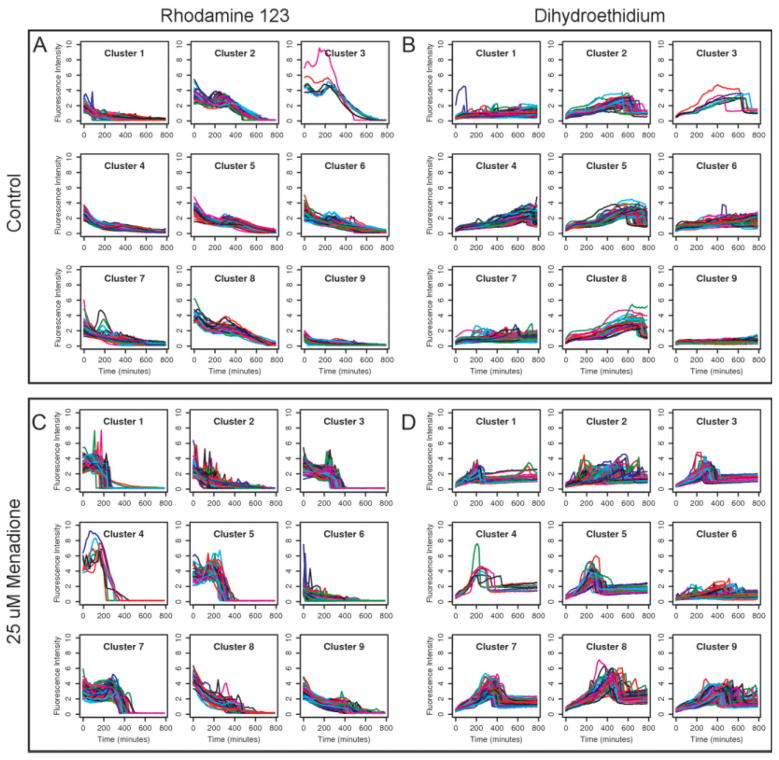
Figure 3. k-means clustering was performed on Rh123 and DHE time course data under two experimental conditions.
Because clustering was performed on combined data, the cluster assignments in the two channels correspond to each other. Control cells with no menadione treatment are shown in Panels A and B. Cells treated with 25 μM menadione are shown in Panels C and D. Several distinct response patterns can be identified from the clustered data. The response patterns differ in shape and timing between the two conditions, but also within each condition, reflecting the wide diversity of behaviors possible in a cell population. For each fluorescence channel, the general shape of each time course is constrained by the mechanism of the dye used, but there is considerable variation in the magnitude and timing of the responses.

