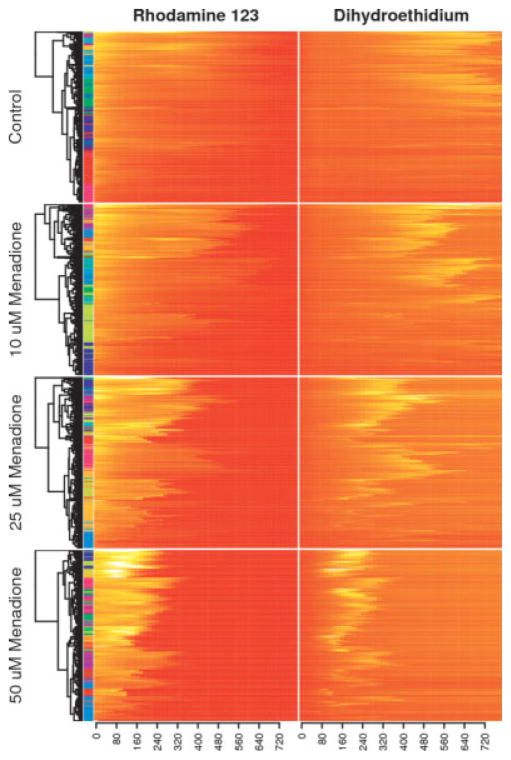
Figure 4. Hierarchical clustering with the Euclidean distance and complete linkage was performed on combined Rh123 and DHE time course data in a dose response experiment, with dendrogram nodes reordered according to average fluorescence intensities.
Each heatmap row corresponds to the behavior of a single cell from one of the arrays, and the color bar on the left side indicates cluster assignments using the k-means algorithm. Presenting dose response data as a set of clustered heatmaps is an information-rich alternative to classic survival curves. Although it is straightforward to represent the collected data as a set of survival curves, the heatmap approach better highlights the diversity of cell responses to each stimulus and allows one to appreciate the temporal relationships between multiple fluorescence channels.

