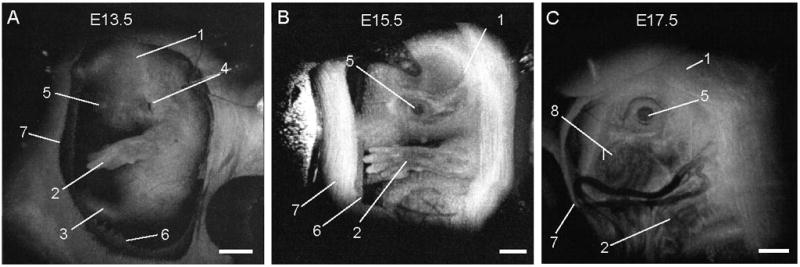
Figure 3. 3D OCT imaging of mouse embryos in utero at different developmental stages.

Each data set for the reconstructions was acquired as a series of 512 × 512 A-scans over a 10mm × 10mm × 2.2 mm volume. 1, head; 2, forelimb; 3, hindlimb; 4, pinna of ear; 5, eye; 6, yolk sac; 7, uterine wall; 8, follicles of vibrissae. Scale bars correspond to 1mm. Adopted from [42].
