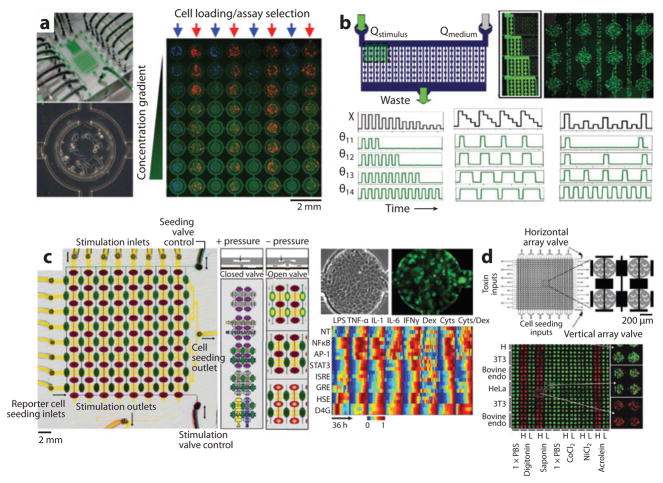
Figure 7.
Examples of microfluidic cell arrays. (a) A microfluidic array delivers a concentration gradient of fluorescent dextran in columns to independently seeded rows of fluorescently labeled cells. The figure illustrates the full device (top left), the 64-element cell culture array (right), and a single element (lower left) (110). (b) A microfluidic device uses flow-encoded switching to control parallel delivery of different stimulus timing regimens to preseeded GFP reporter cells. The figure illustrates device design (top left), dye filled channels at different time points (top middle), channels seeded with fluorescent GFP reporter cells (top right), example excitation sequences (black) and the resulting dynamic exposures of 4 channels (green) varying pulse duration, width, and frequency (109). (c) A microfluidic valve-controlled array enables dynamic gene expression profiling. The figure illustrates device design, valve design, reporter cell seeding, stimulation strategy (left), phase and fluorescence images of GFP reporter cells in an array element (top right), and a heat map quantifying dynamic GFP responses across the array (bottom right) (111). (d) A microfluidic array for toxin screening. The figure illustrates device design (top left), close-up of valve-controlled array elements (top right), and fluorescence images of cell viability (green, live: red, dead) across the array of cell lines and putative toxins (bottom) (113).

