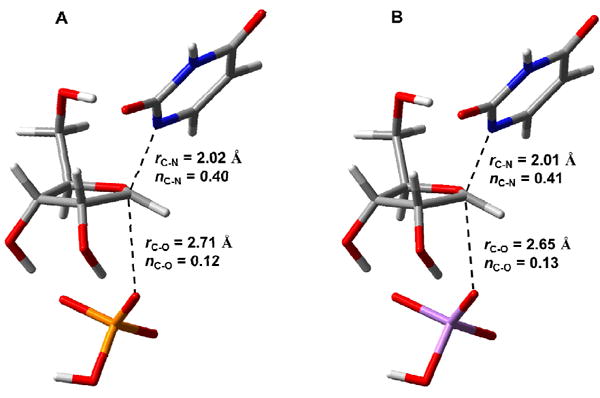
Figure 9.

Stick models of stationary-point transition structures for uridine cleavage calculated by DFT in the gas phase with (A) Pi or (B) arsenate as nucleophiles. Carbon atoms are shown in gray, nitrogen in blue, oxygen in red, hydrogen in white, phosphorus in yellow, and arsenic in purple. Bond lengths (in Å) and bond orders (Pauling bond order) are shown for leaving group and nucleophile positions at the calculated transition state.
