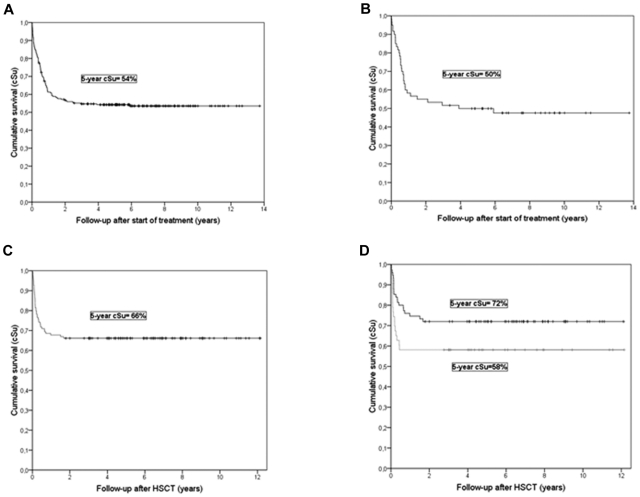
Figure 2.
Kaplan-Meier survival curves. (A) All eligible study patients treated with HLH-94 (n=249). (B) All patients with an affected sibling (n=60). (C) All patients who received transplants (n=124). (D) Survival related to HLH disease activity at HSCT (nonactive disease: black line; active disease: grey line; the time in both panels C and D is shown as the time from HSCT).

