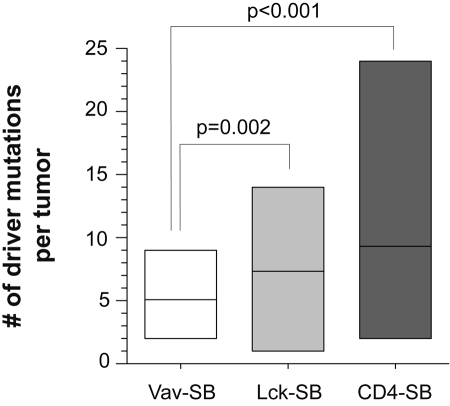
Figure 5.
The number of driver mutations in each tumor is indicated for each of the 3 tumor models. The average number of driver mutations differed significantly across the models. A t test was performed to compare the differences between each pair of models. No significant difference was observed between Lck-SB and CD4-SB tumors.

