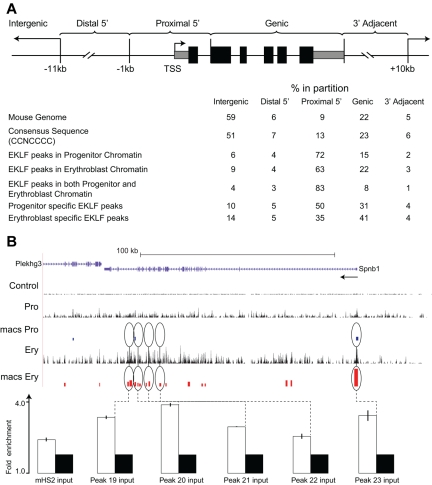
Figure 2.
Distribution of EKLF occupancy. (A) The mouse genome sequence was partitioned into 5 bins relative to RefSeq genes. The table shows the percentage of the genome represented by each bin (mouse genome), the distribution of the total CCNCNCCCN EKLF consensus binding sequences (consensus sequence), and the percentage of the total EKLF peaks for each bin. EKLF peaks in progenitor or erythroblast chromatin refer to all peaks identified in those cell populations. EKLF peaks in both progenitor and erythroblast chromatin refer to the subset of peaks found in both populations. Progenitor or erythroblast-specific EKLF peaks refers to the subset of peaks specific to that cell population. (B) EKLF occupancy in the mouse Spnb1 locus. Top panel: Organization of the Spnb1 locus on the UCSC browser. The direction of transcription is indicated (arrow). The Control, Pro, and Ery tracks represent the sequence reads derived from libraries of input chromatin or HA-enriched chromatin from progenitor cells or erythroblasts, respectively. The bars in the MACS Pro and MACS Ery tracks represent the EKLF peaks (at the p06 level of significance) identified by MACS in the progenitor cell and erythroblast data, respectively. Several of these sites were chosen for validation by PCR-based ChIP analysis. White bars represent the mean (± SD) fold enrichment in HA-enriched chromatin from unfractionated day E13.5 fetal liver cells compared with input chromatin (black bars). Peaks 19 to 23 are located in intragenic regions of erythroblast chromatin. All show significant enrichment (P < .0001).

