Figure 6.
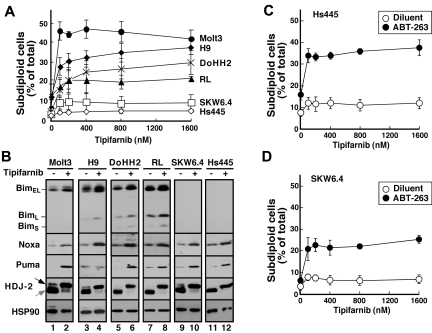
Correlation between tipifarnib-induced Bim up-regulation and apoptosis. (A) After cells were treated for 72 hours with the indicated tipifarnib concentration, samples were stained with propidium iodide and subjected to flow microfluorometry. (B) After cells were treated with diluent (odd lanes) or 800nM tipifarnib (even lanes) in the presence of 5μM Q-VD-OPh, whole cell lysates were subjected to SDS-PAGE followed by immunoblotting with antibodies to the indicated antigen. For each antigen, all lanes were derived from corresponding signals on a single piece of x-ray film but were rearranged for clarity. (C-D) Hs445 (C) or SKW6.4 cells (D) were treated for 72 hours with the indicated tipifarnib concentration in the absence (open circles) or presence (closed circles) of 125nM ABT-263, stained with propidium iodide, and subjected to flow microfluorometry. Error bars in panels A, C, and D indicate mean ± SD of 3 independent experiments.

