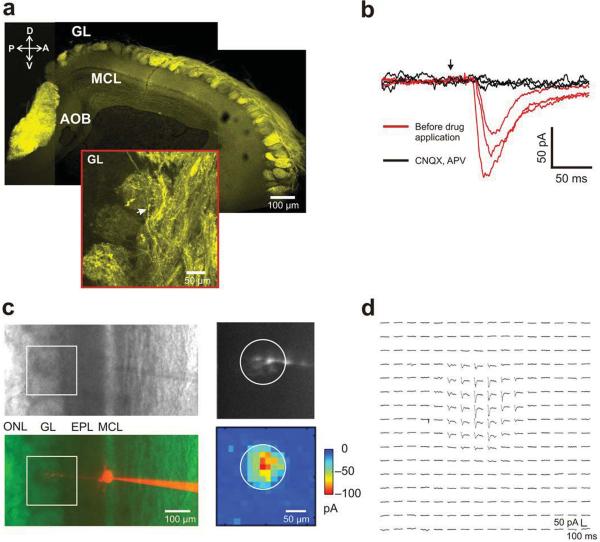
Figure 1. OMP-ChR2 (ORC) transgenic expression pattern; Laser scanning photo-stimulation (LSPS) identifies parent glomeruli for mitral cells in ORC mice olfactory bulb slices.
a. Confocal micrograph of olfactory bulb sagittal section from ORC mice showing EYFP fluorescence; GL – glomerular layer, MCL – mitral cell body layer, AOB – accessory olfactory bulb, A-anterior, P-posterior, D-dorsal, V-ventral; scale bar is 100 μm.
(Inset) higher magnification view: arrow indicates olfactory sensory neuron axons; scale bar is 50 μm.
b. Bath application of glutamate receptor antagonists CNQX and APV; the three traces for each of the conditions correspond to three adjacent photo-stimulation foci 50 μm apart; red trace – before drug application; black trace – during drug application; arrow indicates the time of photo-stimulation.
c. Phase (Top left) and red fluorescence image (Bottom left) of one mitral cell filled with Alexa 546; box indicates the field of photo-stimulation; (Top right) Primary dendrite and tuft projecting to a glomerulus. (Bottom right) Matching two-dimensional light activation map (16 X16 2DLAM); inter-foci distance = 15 μm; photostimulation duration = 1 ms. Note the fiduciary circle on the two panels. Color represents peak amplitude of the light induced currents; ONL – olfactory nerve layer; scale bar is 100 μm.
d. Currents recorded in the mitral cell by LSPS in c are shown at locations corresponding to each point in the 16 × 16 grid; traces were averaged across 4 repeats; 1.6 mW laser power was used. Scale bars are 50 pA and 100 ms respectively.

