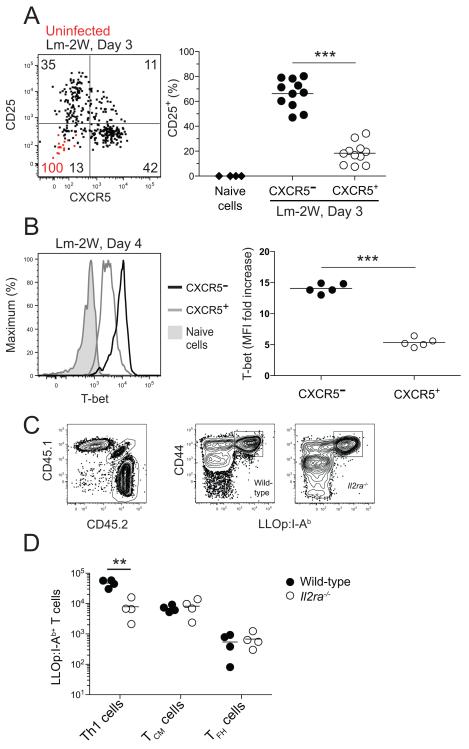
Figure 5. Development of Th1 effector cells depends on CD25.
(A) Dot plot of CD25 versus CXCR5 expression by LLOp:I-Ab-specific cells from naïve mice (red dots) or from mice 3 days after intravenous infection with Lm-2W bacteria (black dots). The values on the plots represent the percentage of cells in the indicated quadrants from naïve (red) or Lm-2W-infected (black) mice. The scatter plot shows the percentage of CD25+ total naïve CD4+ T cells from uninfected B6 mice (diamonds) or CXCR5− (filled circles) or CXCR5+ (open circles) LLOp:I-Ab-specific cells from mice 3 days after intravenous infection with Lm-2W bacteria. ***, p < 0.001. (B) T-bet expression in total naïve CD4+ T cells from uninfected B6 mice (shaded), or CXCR5− (black) or CXCR5+ (gray) LLOp:I-Ab-specific cells from mice 4 days after intravenous infection with Lm-2W bacteria, with a scatter plot showing the fold increase of T-bet mean fluorescence intensity (MFI) of the indicated LLOp:I-Ab-specific populations over the T-bet MFI of naïve CD4+ T cells. ***, p < 0.001. (C) Plots of CD45.1 versus CD45.2 expression and CD44 expression versus LLOp:I-Ab tetramer staining of CD4+ T cells in a tetramer-enriched sample from a radiation chimera produced with CD45.2+ wild-type and CD45.1+ CD45.2+ Il2ra−/− bone marrow, 5 days after intravenous infection with Lm-2W bacteria. (D) Number of LLOp:I-Ab-specific Th1, TCM, and TFH cells identified as in Figure 2B of wild-type (filled circles) or Il2ra−/− (open circles) origin from individual mice, 5 days after intravenous infection with Lm-2W bacteria. **, p < 0.01.

