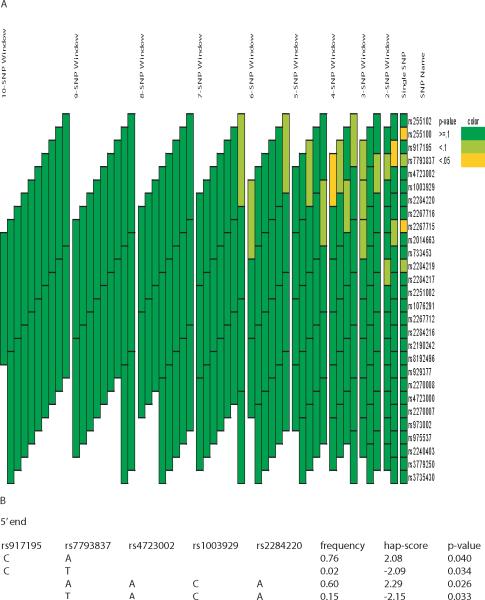
Figure 2. Association analyses of CRHR2 variants and acute bronchodilator response in CAMP.
(A) Significance of association, as indicated by simulated global p-values, between genetic variants of CRHR2 (individual SNPs and haplotypes) and phenotype is represented by color and constructed using the graphical tool GRASP[33]. The SNPs making up each haplotype block can be found by matching the upper and lower boundaries of each block to the SNP name on the ‘SNP Name’ column. (B) Haplotypes within the associated blocks were further assessed for association. Hap-scores are the score statistics calculated from Haplo.stats. Only haplotypes with significant (simulated) p-values were listed.

