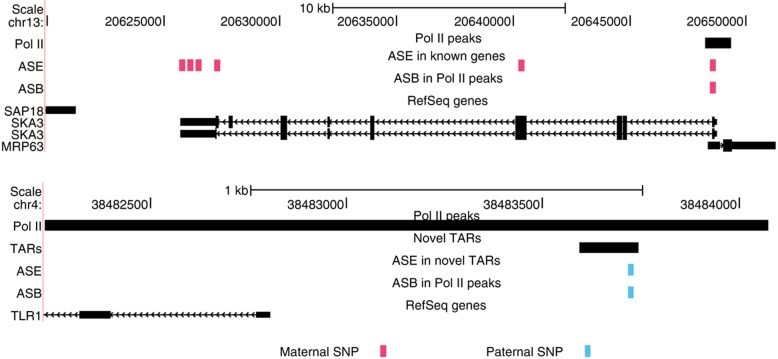
Figure 4.
Examples showing ASE and ASB for a gene (SKA3 on chromosome 13) and a novel TAR (on chromosome 4). Paternal SNPs exhibiting either ASE or ASB are indicated in blue and corresponding maternal SNPs are indicated in red. We also indicate the region of enriched Pol II binding in black. For these two examples, we see coordinated maternal binding and expression for the known gene and coordinated paternal binding and expression for the novel TAR.

