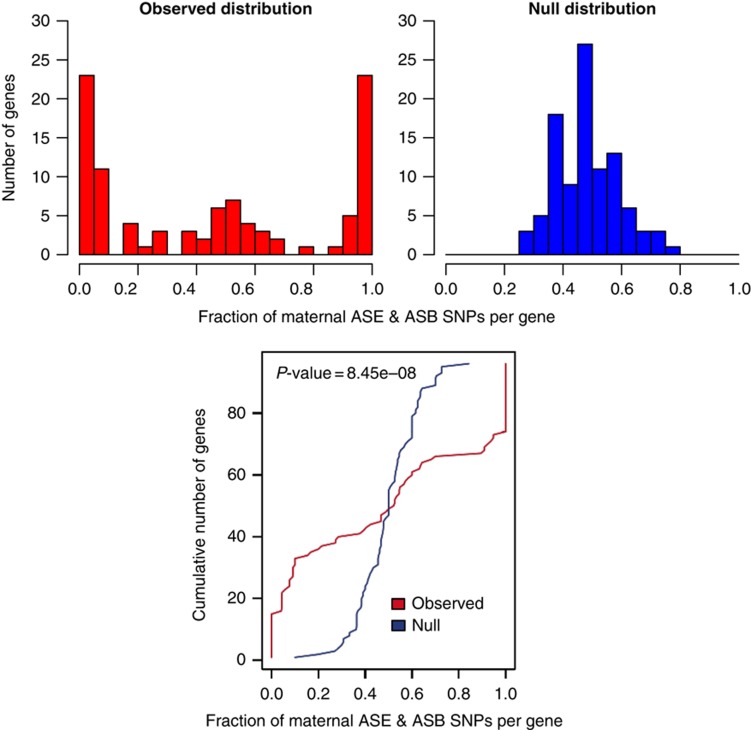
Figure 5.
We compare the degree of coordination in the maternal or paternal preference of ASB and ASE SNPs within a gene, to that of a random null distribution. All genes that contain 10 or more such SNPs across all our GM12878 data sets are included. Using this set of genes and number of SNP per gene, a null distribution is generated. The null hypothesis is that each SNP within a gene has an independent 50/50 chance of being maternal or paternally biased. The histograms show the distribution of maternal fraction across all genes, compared with that for the null distribution. The observed data show a strong tendency toward either zero or one, indicating that, within a gene, the SNPs have a strong tendency to be either mostly maternal or paternal. The lower graph displays the results of a Kolmolgorov–Smirnov test to support the claim that the two distributions are significantly different, with a P-value of 8.45e−8 (maximal difference is indicate with a green line).

