
Figure 4.
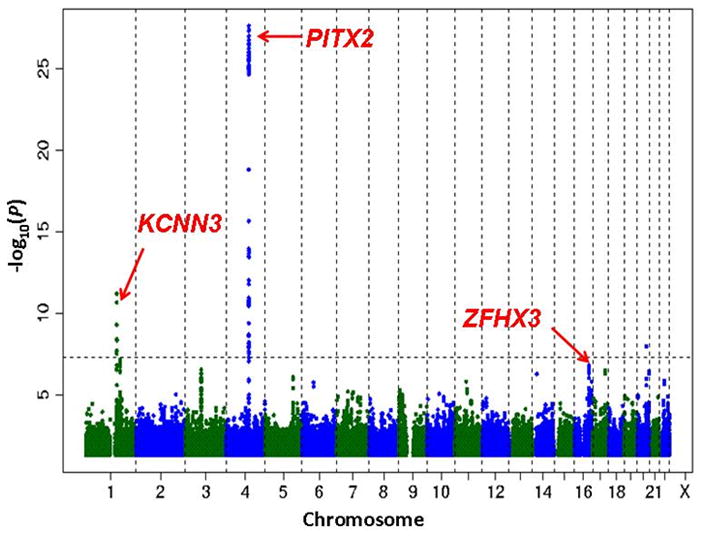
The figure displays the chromosomal positions for each of the three loci associated with atrial fibrillation (AF) in meta-analyses. Such a representation is designated a “Manhattan plot,” as it suggests the New York City skyline. While the x-axis displays the chromosomal position, the y-axis indicates the statistical significance for the association between the single-nucleotide polymorphism (SNP) and the phenotype of interest. The dotted line shows the threshold for statistical significance, adjusted for multiple testing to P<10−8. SNPs with P >0.05 are not displayed on the plot. The initial SNPs identified were on chromosome 4q25 located adjacent to PITX2 and had an effect size as high as 2-fold (Odds ratio [OR] 2.12; 95% confidence interval [CI], 1.77 to 2.54, P=6.3×10⁻¹⁸) in Icelandic individuals diagnosed with AF at ≤60 years.108 The second locus, associated with ZFHX3, identified 3 SNPs with relative risk ranging from 1.26–1.65.105 The third and most recently published SNP, identified on the 4q25 locus with OR 2.03, 95% CI, 1.79–2.30, P=2.5×10−28.106 Figure modified with permission from Ellinor PT, et al.106