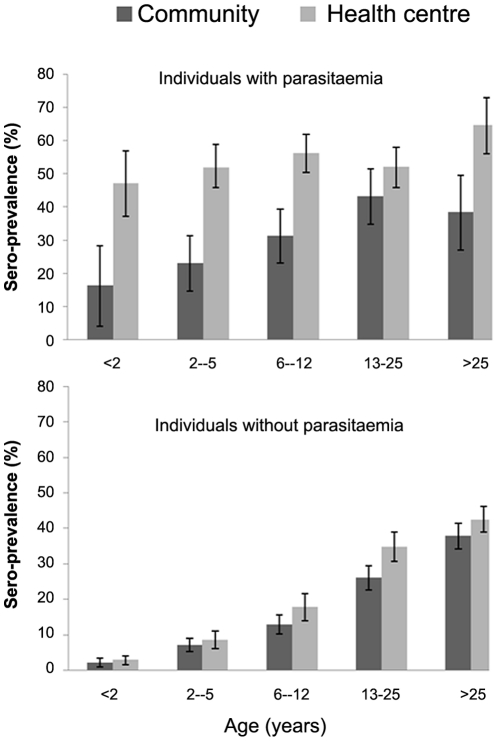
Figure 6. Age specific seroprevalence in participants with and without patent parasitemia seen during the health centre or community surveys.
The horizontal axis shows the age groups and the vertical axis shows seropositive individuals (%) in each age group. Percentage and 95% confidence intervals of seroprevalence are shown by the bars.

