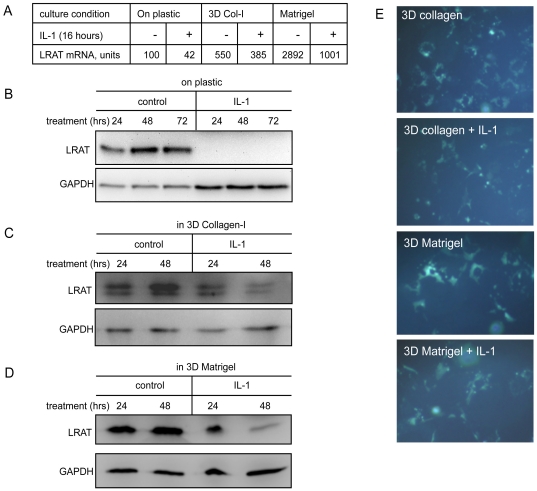
Figure 3. Interleukin-1 suppresses LRAT expression in primary rat hepatic stellate cells cultured in 3D ECM.
(A) HSCs in equal number were seeded on plastic or embedded in 3D ECM (type I collagen or Matrigel, 1×10⁵ cells in 0.4 cm3). After recovery, the cultures were treated with or without IL-1 (10 ng/ml) for 18 hours. LRAT gene expression was measured by Affymetrix DNA microarray analysis, which has been extensively calibrated for many genes by qRT-PCR. (B–D) The levels of LRAT protein expressed by HSCs cultured on plastic or in 3D ECM. The effects of IL-1 treatments on LRAT expression were measured by Western blot analysis. GAPDH was used as loading control. (E) Vitamin A autofluorescence in the cultures was visualized by UV excitation for HSCs cultured in 3D ECM treated with or without IL-1 for 3 days. Original magnification ×200.

