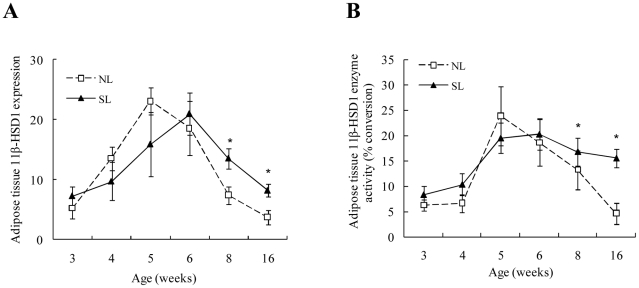
Figure 5. Retroperitoneal adipose tissue 11β-HSD1 mRNA expression (A) and enzyme activity (B) from W3 to W16 in SL and NL rats.
Data are expressed as mean ± SEM. Differences between groups at corresponding time points were analyzed by unpaired Student's t-test. *P<0.05 for SL vs. NL rats at the corresponding time points (n = 6–9).

