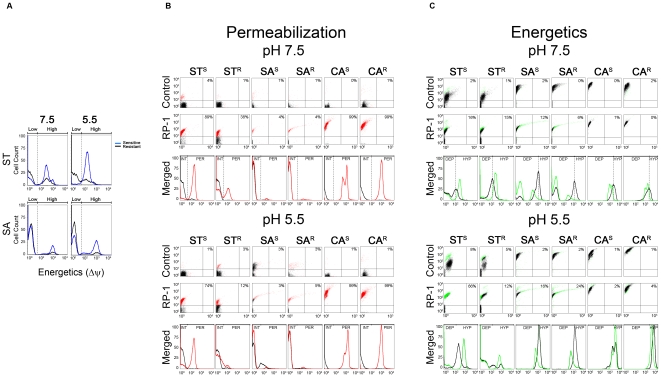
Figure 1. Flow cytometric analysis of: (A) basal membrane electronegativity; and (B) membrane permeabilization or (C) energetics for untreated and RP-1 treated cell populations at pH 7.5 and 5.5.
(A) Basal membrane electronegativity (untreated stained cells) for sensitive versus resistant ST and SA at pH 7.5 and 5.5. Comparison of membrane permeabilization (B) or energetics (C) between untreated (black) and RP-1 treated microorganisms. RP-1 and Control panels (B,C) depict fluorescence (Y-axis) vs. FSC (forward scatter; size / granularity; X-axis) of individual cells. Indicated values represent the percentage of cells that are beyond the control (black) area. Merged panel shows histogram analysis of: (B) permeabilization - control (black) vs. RP-1 treated (red); or (C) energetics - control (black) vs. RP-1 treated (green). INT = intact cells; PER = permeabilized cells; DEP = depolarized cells; HYP = hyperpolarized cells.

