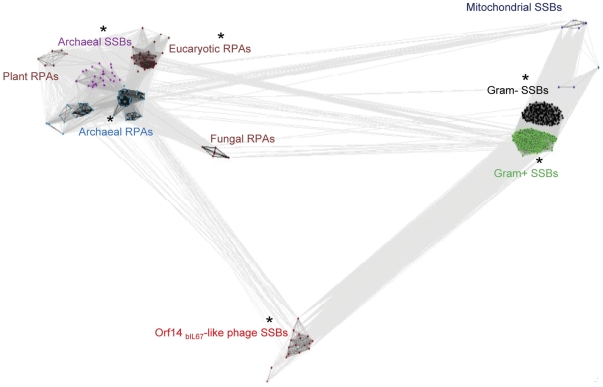
Figure 1. Cluster map of the ssDNA-binding protein superfamily.
The complete sequence dataset for SSB proteins was clustered using CLANS, which classified all ssDNA-binding proteins into 10 subfamilies containing related proteins. CLANS runs BLAST on given sequences and clusters them in 3D according to their all-against-all pairwise similarity. A 2D representation was obtained by seeding sequences randomly in the arbitrary distance space. Protein subfamilies containing members with known structures are indicated with asterisk. In the network, each dot represents a single protein. Sequences of phages encoding Orf14bIL67 -like SSBs proteins are shown in red. Other colours: purple – Crenarchaea , blue – Euryarchaea, maroon – Eukaryotes, dark blue – mitochondria, black – Gram-negative bacteria, green – Gram-positive bacteria.

