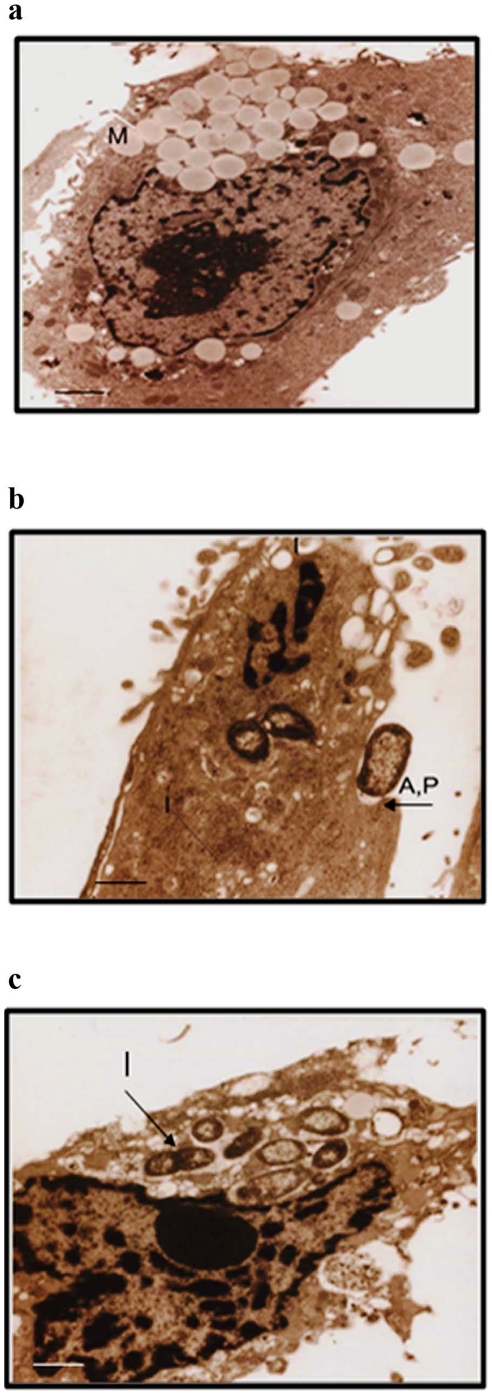
Figure 6. Shigella dysenteriae adherence and invasion of human epithelial cells by Transmission Electron Microscopy.
After 1 h and 2 h of infection, cells were fixed and processed for Transmission Electron Microscopy analysis as described in materials and methods. Control cells showed intact nuclei and other cell organelles (a). 1 h of infection of HT 29 cells with Shigellae showed the adherence and pseudopod projection formation (b). Endocytic processes and phagocytosis of bacteria was seen in the vacuoles of HT 29 cells at the end of 2 h infection (c). The scale bars indicate 1 µm. [M – Mucin; A – Adherence; P – Pseudopod formation; I - Invasion].

