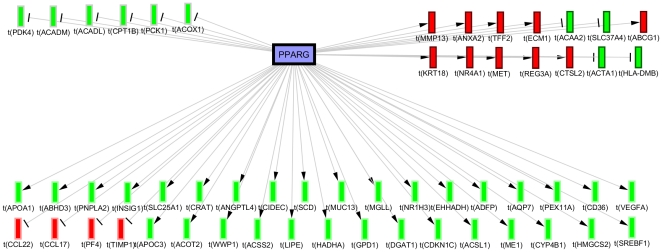
Figure 3. Causal network shows the experimental gene expression changes enriched for the PPARG- hypothesis in the 15 mg/kg group.
36 genes are consistent with the predicted decreased directionality (bottom), 14 are contradictory (top right) and 6 are ambiguous due to contradictory literature (top left). (Blue nodes = predicted decrease, Red nodes = observed mRNA decrease, Green nodes = observed mRNA increase).

