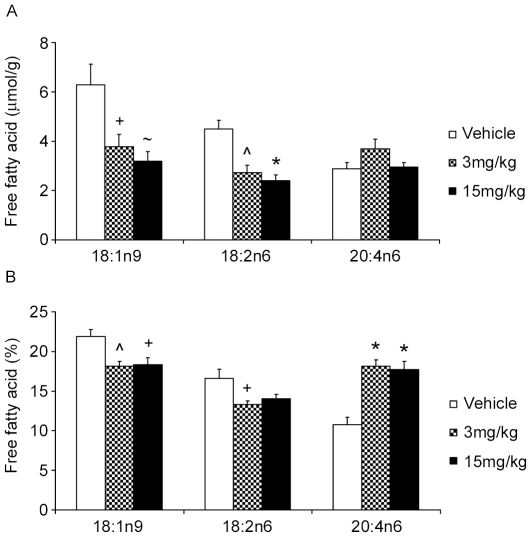
Figure 6. Results from lipomics analysis showing effect of PF-04620110 on tissue levels of two of the most abundant free fatty acids: Oleic 18:1n9 and Arachidonic acid 20:4n6 in rat jejunum.
Represented in raw values (umol/g tissue, panel A) and normalized values (% of total free fatty acids, panel B). Symbols indicate significance from vehicle with P value thresholds of <0.001 (*), <0.005 (∧), <0.01 (∼), <0.05 (+) for n = 8 rats per treatment group.

