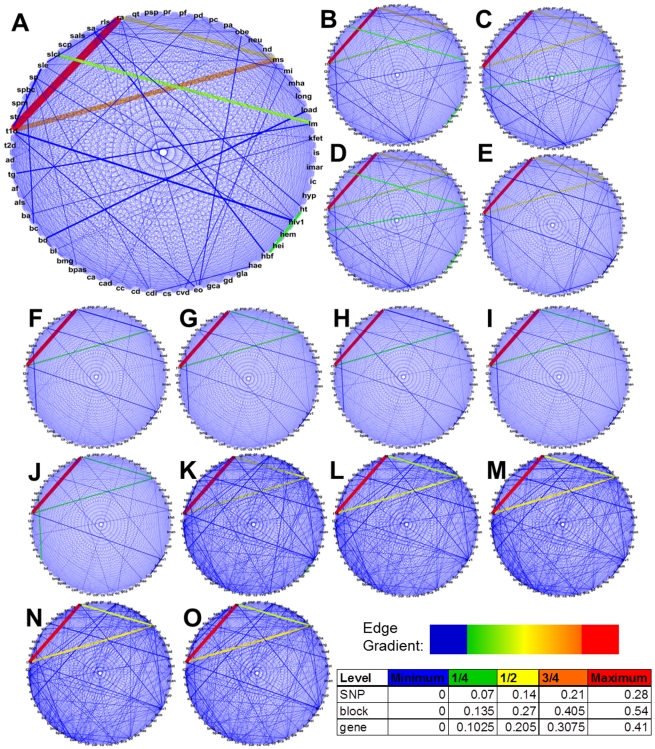
Figure 2. Human disease relatedness networks (DRNs) for 61 diseases and phenotpyes.
DRNs across three levels of SNP data analysis for five populations: CEU (A, F, K), CHB (B, G, L), JPT (C, H, M), CHB+JPT (D, I, N), and YRI (E, J, O). The three levels of analysis were SNP (A-E), blocks (F-J), and genes (K-O). The placement of disease/phenotype abbreviations was consistent for all DRNs for ease of comparison. The width of the edge and color correspond to the Jaccard indexes for each disease pair. Line width increases from small to large indexes. The color scale increases in the order blue, green, yellow, orange, and red. The inserted table lists index percentile cutoff values for each line color designation. Line colors were designated according to a gradient of the listed colors from minimum to maximum Jaccard index.

