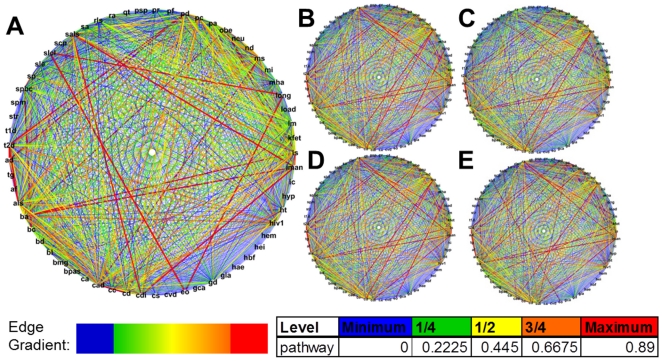
Figure 3. Human DRNs from pathway-level analysis for 61 diseases and phenotypes.
Analysis for five populations: CEU (A), CHB (B), JPT (C), CHB+JPT (D), and YRI (E). The edge width and color correspond to the Jaccard indexes for each disease pair. Line width and color is scaled the same as in Figure 2. The inserted table lists index cutoff values for each line color designation.

