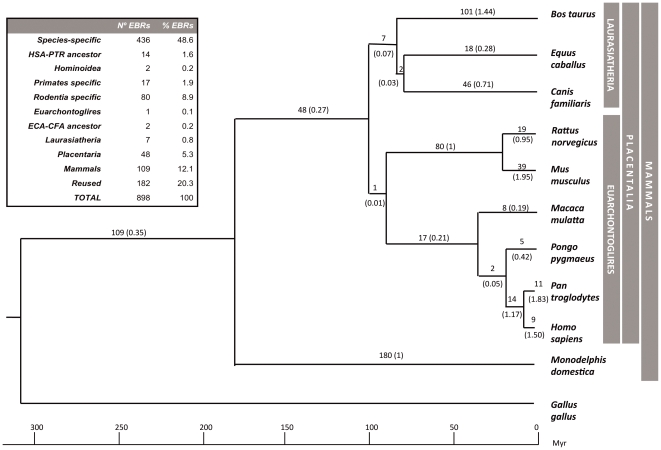
Figure 3. EBRs mapped in the phylogenetic tree of mammalian species included in our study.
The phylogeny was based on previous studies [33], [62]. The number of specific evolutionary breakpoint regions detected is plotted in each phylogenetic branch. The number of EBRs per million years detected for each lineage is displayed in brackets. Inset shows the number and percentage of EBRs found in our study.

