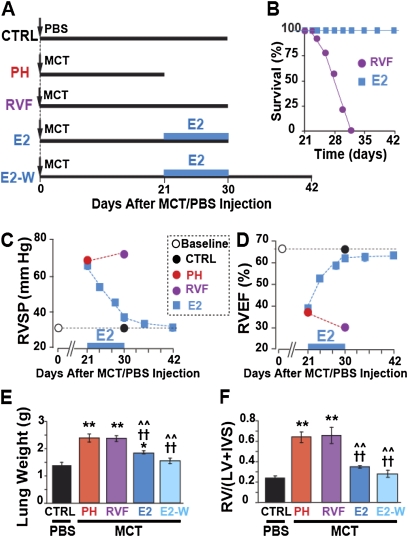
Figure 1.
Estrogen (E2) rescues severe pulmonary hypertension (PH). (A) Experimental protocol: male rats were injected with monocrotaline (MCT) or phosphate-buffered saline (PBS) at Day 0. The thick horizontal lines represent the length of each experimental group. At Day 21, animals were either killed (PH group), or left untreated to develop right ventricular (RV) failure (RVF group). Both E2 and E2-W groups received E2 only from Day 21 to Day 30. All of the rats in the E2 group were killed at Day 30, whereas the rats in the E2-W group were kept for another 12 days until Day 42 after E2 withdrawal at Day 30. (B) Survival plot. (C) RV systolic pressure (RVSP) and (D) RV ejection fraction (RVEF) at baseline (open circle) and after a single MCT/PBS injection in control mice (CTRL; black circle), PH (red circle), RVF (purple circle), and E2-treated (blue squares). For simplicity, RVSP and RVEF are only shown at the end of the experiment, except for the E2-treated group, for which these parameters are shown as a function of time. The black dotted lines represent the baseline levels. (E) Lung weight and (F) RV hypertrophy index in CTRL (black bar), PH (red bar), RVF (purple bar), E2 (dark blue bar) and E2-W (light blue bar). *P < 0.05 versus CTRL, **P < 0.001 versus CTRL; ††P < 0.001 versus PH; ^^P < 0.001 versus RVF (n = 6–8 rats per group). IVS = interventricular septum; LV = left ventricular wall.

