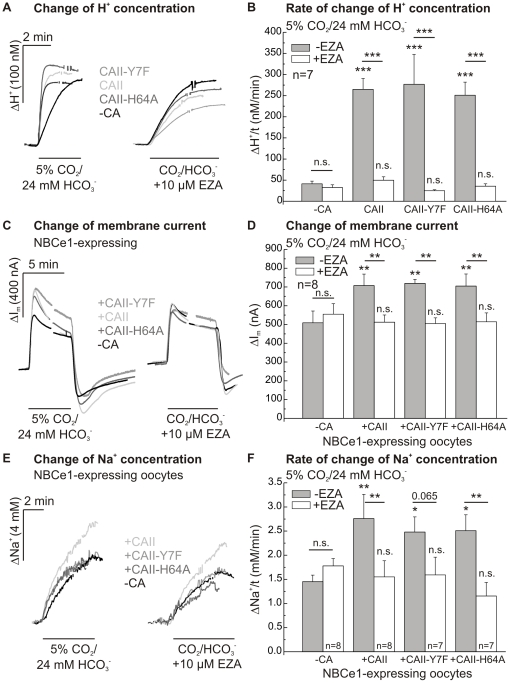
Figure 5. Activity and effect of CAII mutants on NBCe1 transport activity.
Changes of the intracellular proton concentration as recorded in native, CAII-, CAII-H64A- and CAII-Y7F-expressing oocytes (A) to determine rates of rise of the proton concentration (B). Original recordings of the changes in membrane current (C) and intracellular sodium concentration (E) in NBCe1 and CAII-, CAII-H64A- or CAII-Y7F- coexpressing oocytes after application of 5% CO2/24 mM HCO3 −-buffered solution before or during application of EZA (10 µM). Statistical analysis of membrane current (D) and rates of rise of intracellular sodium concentration (F) revealed an increase in NBCe1 transport activity after coexpression of either CAII or one of the two mutants. The asterisks above the bars correspond to the control cells without CA (−CA) before (−EZA) or during EZA (+EZA) application.

